What is Twitterstream?
Twitterstream is a searchable heatmap that collects and analyzes the sentiment of tweets in the United States. The sentiment analysis takes in account not only the tweet text but the emojis as well.
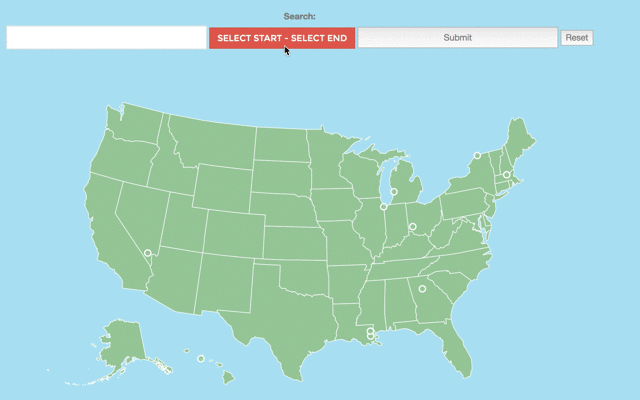
Here is an example of me using it under the topic of "nba". I filter the search by date and then enter a key word to search upon, in this case nba. This will then return to me a heatmap of all the tweets we have relating to nba and their sentiment (blue for good, red for bad).
The Architecture
Here's where the fun stuff really comes in. Over the course of the semester we built, destroyed, and rebuilt our backend architecture multiple times.
First Draft - Batch Jobs
First of, we started with a model that goes as follows: A tweet collector module reads from a stream, writes to a local JSON file, and then uploads to our mongolabs database everyday. This was clearly not sustainable, as there were so many moving parts just to get data from the Twitter API.
But we went with it for a few weeks and began doing analysis on the data. We didn't need the whole tweet, we only needed a few things and then add sentiment to the tweet text itself. So we chose Map Reduce! Turns out... this was also a bad decision. Doing it this way forced us to run two batch jobs (one for the JSON file to the mongolabs database, and another for the map reduce).
At this point we were manually running batch jobs and started to look at other alternatives. Time to rebuild!
Second Draft - Kafka
We completely scrapped our first draft and instead put Kafka in its place. It allowed multiple reads and writes to the db. As new tweets came in, the consumers of the topic would then perform the sentiment analysis and filter out all the info we didn't need, and then write this output to a db.
And the best part? It did this all in one step. Except for one problem, we were using kafka correctly, but it was way more than what we needed. We did not utilize any of the great things that come with kafka (clustering, replication, and fault tolerance) since we were running it on one node.
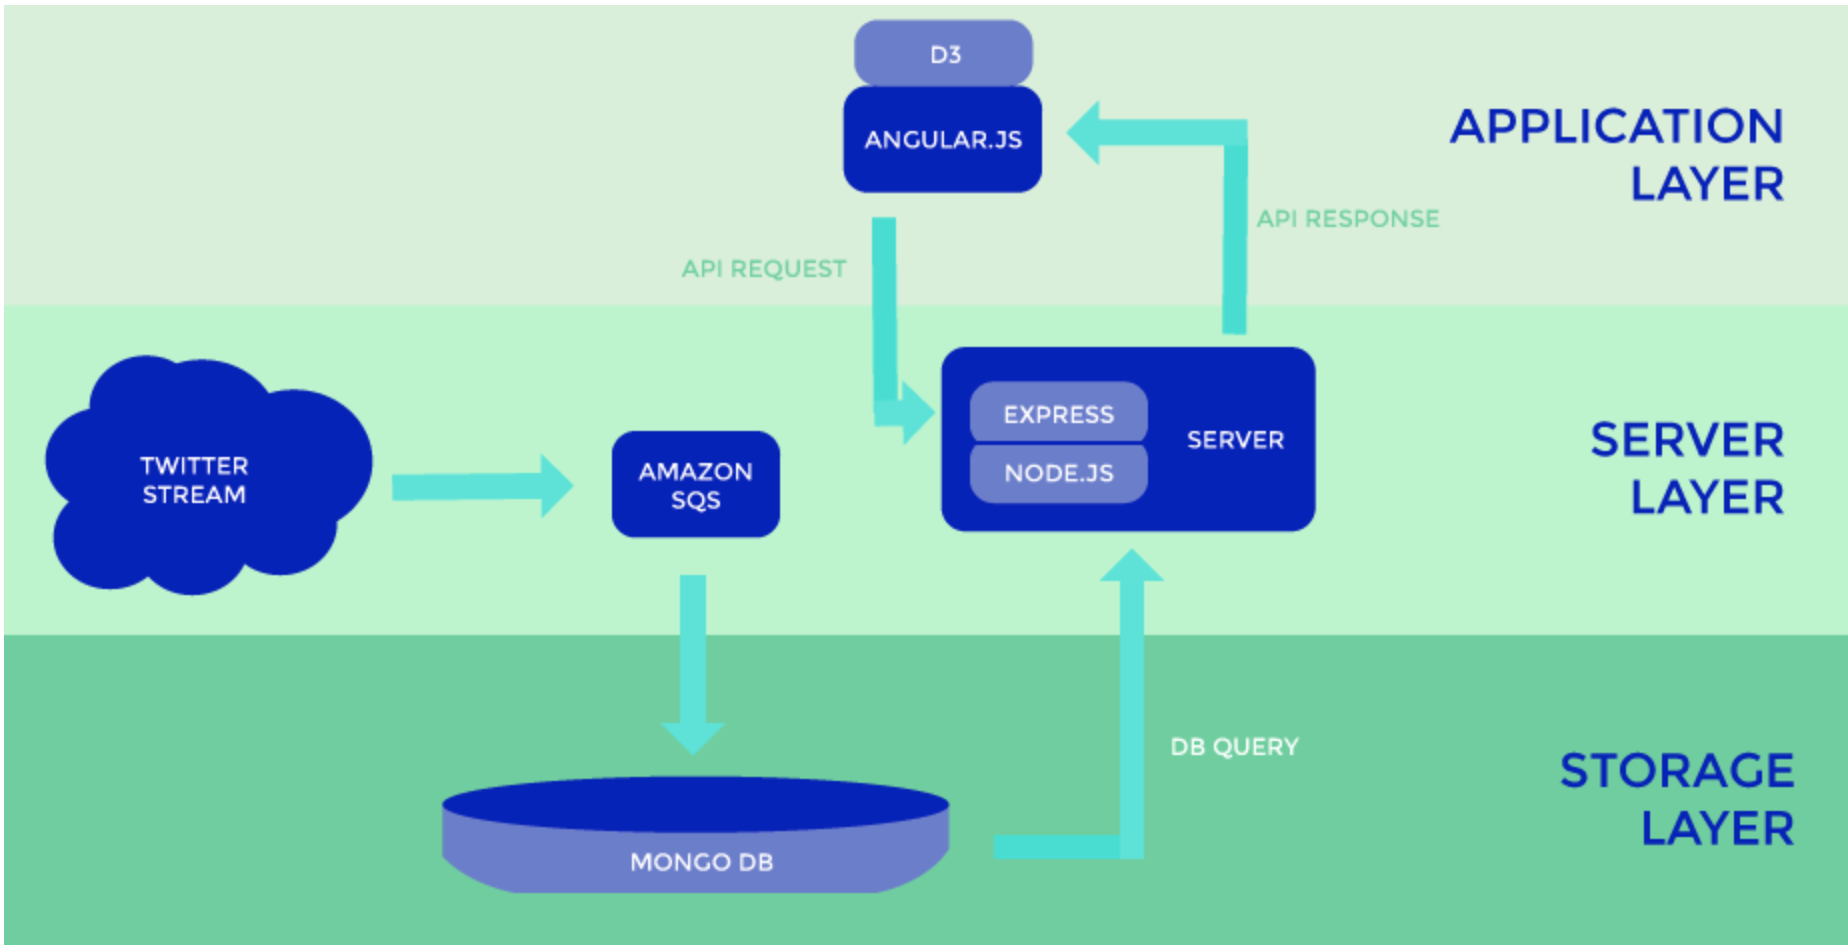
Final Draft - Amazon SQS
So finally we went to the twitter engineers and they suggested to us Amazon SQS. This was exactly what we needed. It would do the same thing as our kafka instance, but it would implement all the clustering, replication, and fault tolerance for us.
The Front End
Finally was the implementation of the front end. We created a node.js server that would serve as an API to our database which could return data to our front end. This data was then thrown into d3.js to make the heatmap. We started to run into issues when we needed to send 100,000s of tweets to the front end.
To fix this, we added limits to the API calls and decided to display only the 10 most recent tweets (and subsequent tweets as they came in from Amazon SQS) until the user performed a search. We used AJAX calls to speed up the process of all of these.
And that's everything we did over the course of the semester!
Improvements
- Implement SOLR to improve search.
- Get a better sentiment analysis.
- Zoomable map and improve front end.
Atlas Expo
We later presented this at the Atlas Expo along with the other projects from many other classes. Check out more here!
